Overview
JnetPlus is interactive web-based Java viewer for visualization of data dependances
in form of two- or tree-dimensional graphs. It is based on a 3D graphics engine of
Jmol, popular molecular viewer for
chemical and crystallographic protein structures.
JnetPlus is a fast and ready to use tool that can be easily incorporated into html pages
with no additional programming effort. It is suitable for use by any web services and databases
that require dynamic graphical visualization of complex data with rich interactive and
descriptive capabilities.
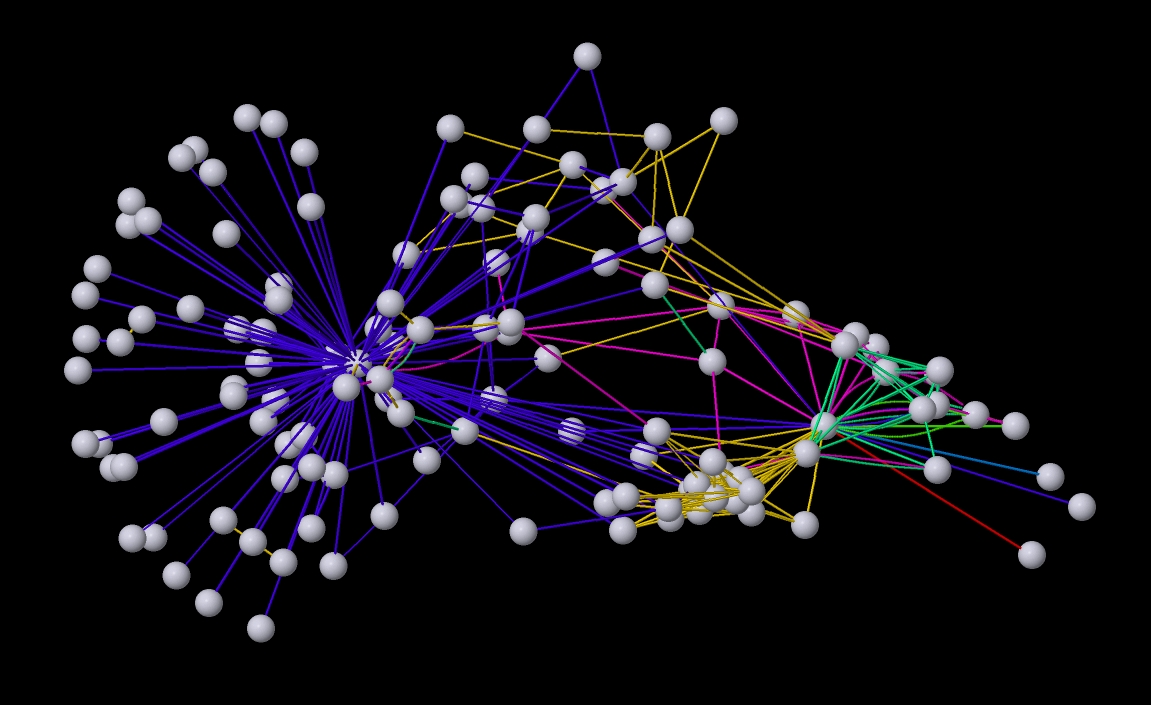
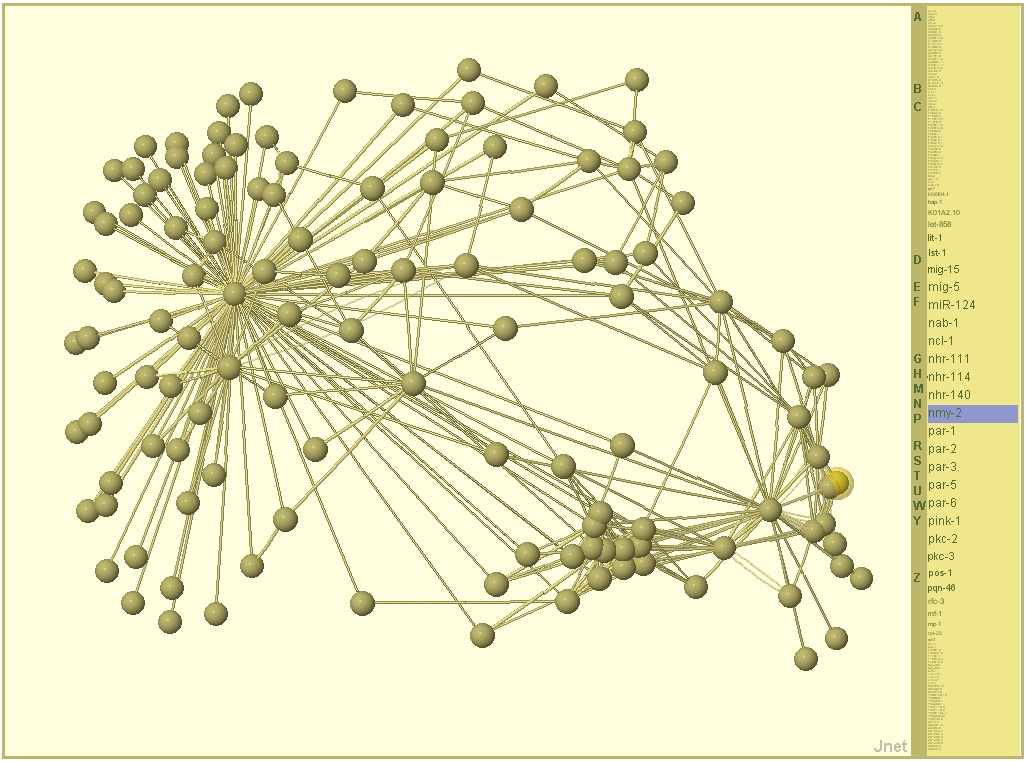
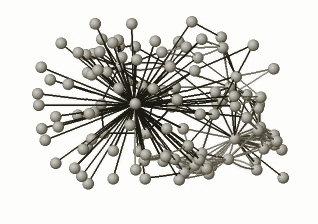
JnetPlus gives posibility to visualize structures that consists of thousands of nodes/edges
and to dinamically manipulate them: see the example with 1469 nodes and 3241 edges
here.
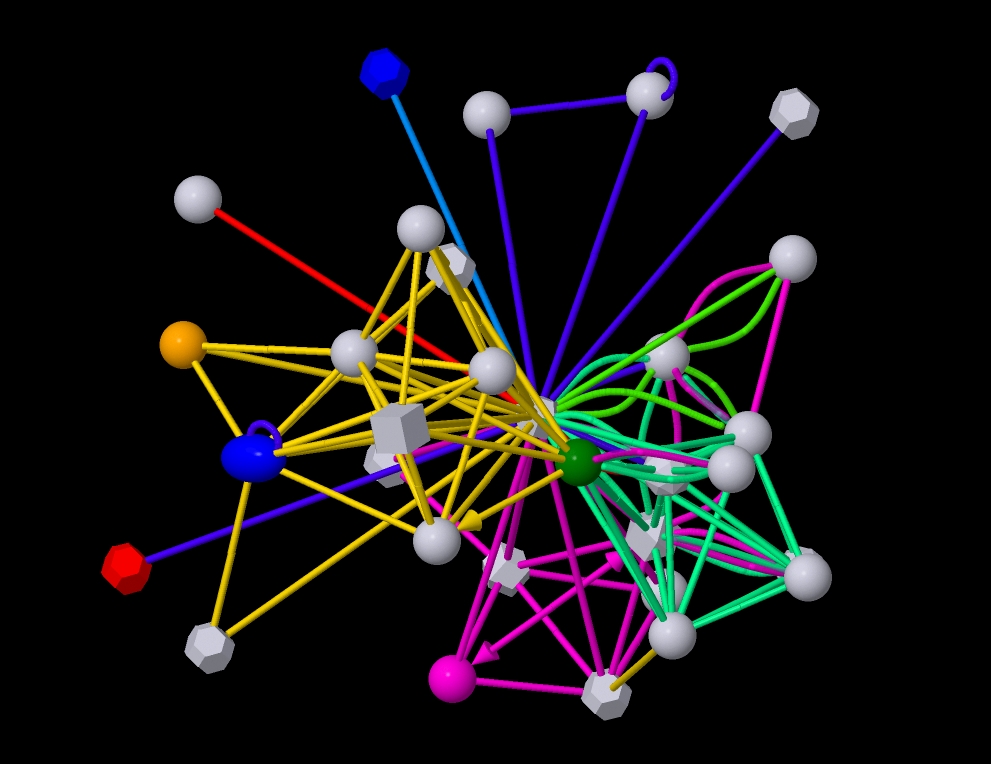
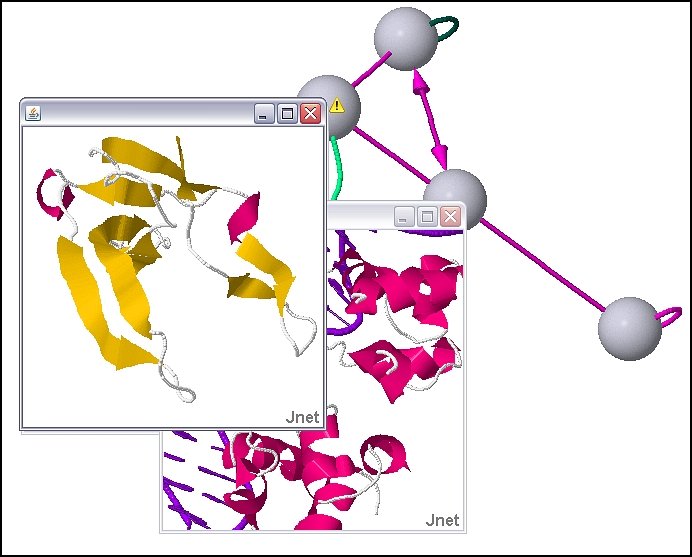
Along with features inherited from Jmol
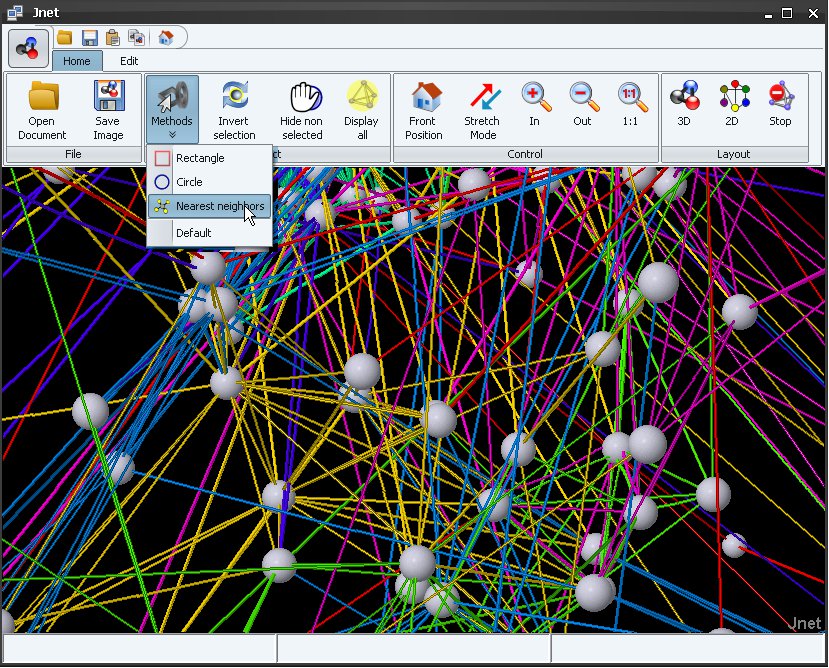
such as "Perspective Depth" or "Stereographic", it provides extended features for nodes and edges selecting,
it's moving, grouping, etc. There is a posibility to control color, size, style of nodes and edges, adding labels,
switching between 2D and 3D and more through the popup menu, by mouse or through the scripts.
The script language is inherited from Jmol project and extended for JnetPlus needs.
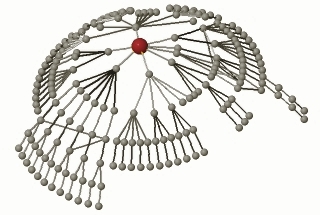
Force-directed drawing algorithm with interactive capabilities is implemented in JnetPlus
as a default embedded graph layout. Tree and radial layouts are available in addition to the spring layout.
Current version supports SIF (Simple Interaction Format) and native JnetPlus formats (see Documentation section).


