Description 01
Description 02
Description 03
Description 04
Description 05
Description 06
Description 07
Description 08
Description 09
Description 10
jnet
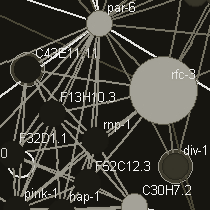
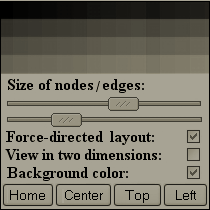
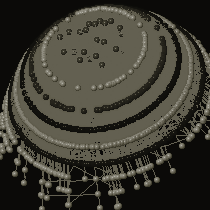
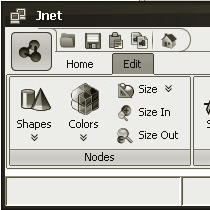
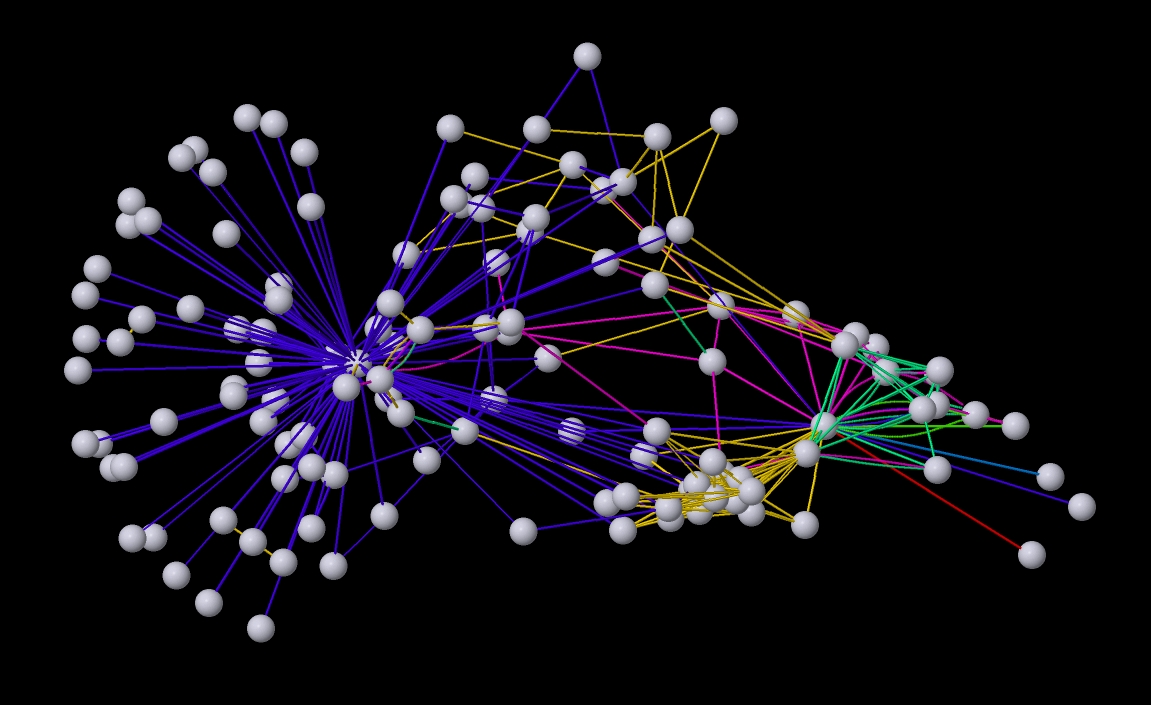
Network and graph visualization tool
plus
Overview
Shapes
Contact Us
Objects
Styles
Web Control example
Layouts
Download
Application
Formats
Installation
Gallery

 This section describe basic
 features of JnetPlus.
 Live demos are presented
 in purpose to demonstrate
 these features in action.

 This section provide list
of all node's shapes.
 It include shape's images,
 names, and corresponding
attributes.

 Basic UI functionality of
 JnetPlus can be extended
 with additional embedded
 control elements like
 fisheye menu, etc.

 Special graphical objects
 can be assigned to each
 node. Current release
 supports OFF models and
 Mol format structures.

The main purpose is to display graphs or networks in 3D. Moreover there is also possibility to visualize it in two dimensions.

JavaScript library inherited from Jmol project gives posibility to communicate with JnetPlus applet through the web control elements.

 The current release
 and examples can be
 downloaded from
 SourceForge web site.

 This section describes
 input data formats
 supported by JnetPlus.
 Short examples and demo
 are included.

 There are two ways
 to implement JnetPlus into
 the html-page:
 1) with applet html-tag or
 2) using javascript library.

 This gallery is a collection
 of screenshorts that gives a
 quick view what JnetPlus
  looks like.

SourceForge.net